
Member Spotlight: Kevin Maillet

Kevin Maillet is one of Groundwork’s hardest working members. A true New Bedford native, Kevin worked his way from selling swordfish in restaurant kitchens to crunching data at national banks. Kevin’s story is inspiring, and he is on a mission to empower others to embark on a career in data science.
Read Kevin’s story in this interview, and then check out the 4-week intro to data science course he will offer at Groundwork! this summer.
What does the typical workday of a data scientist look like?
There really is no ‘typical’ day. Sometimes I’m on the hunt for the next problem to solve. Sometimes I am building visualizations. Other days I unplug and spend the whole day massaging data into a useful format that will help answer a question. Other days I have to put on my project management hat and direct tool deployments and onboarding. Other days I’m working on frameworks that help solve larger business problems. It all really depends. The one thing that I am not is bored.
What are some of the biggest challenges you face in your position?
The human component: In every project you have people, process, and technology. The process and the technology are pretty straight-forward, but people are not. Different things drive different people. Some people are great communicators, others are great organizers, and some are great out-of-the-box thinkers.
Scale is also a big problem. Once you have built something successful, how does it scale? Does it grow linearly? Can you make it scale better, faster, smarter?
The last one is sustainability. How do you ensure sustainability with your projects? Do you have well documented functions, or is the knowledge tribal, meaning it will disappear with the migration of people?
What was your career path like leading up to this?
When I was 18, I dropped out of high school, attained my G.E.D., and joined the Army Reserves. After spending the summer baking in the hot Georgia sun at Fort Benning, I returned home a more disciplined (and slightly crispy) youth. After this, I reported to my father, a small business owner.
For the next seven years or so, I worked with my father in a wholesale/retail seafood setting. We all wore many hats, but if you were to look at the division, my father was sales, my mother was operations, and I was logistics.
One of my fondest memories is showing up at restaurants with 100lb swordfish, slapping them on the table, and negotiating a lunch if I dressed them. Most cooks would hack up the meat if they attempted it, so I ate well. It is an art to get the maximum meat yield off the fish without including the bone. A successfully removed vertebrae was a treat for the cooks, who used the vertebrae for their personal soups.
While my friends were out pursuing college degrees or getting their fill of life, I was getting my MBA the hard way: by actual experience.
My father semi-retired seven years later, which was pretty tough for me. At this point I was skill-less, around 25, and re-entering the job market.
I happened upon an open-house for Sovereign Bank downtown in New Bedford by pure chance. I took a contact center representative position. I was very bored after three months, but luckily an operations analyst position opened up on-site. I applied for it and got it.
Here is where my education truly started from a data science perspective, and how I differ from other data scientists. I remember clearly my first task, which was simply ‘make the interpretative service bill cheaper’. I only received the bill, which was an itemized list of all the times an interpreter was used to assist us translating a customer request. I took one look and saw Spanish was the biggest consumer, so I focused there.
I mapped out all the times it was used in five minute chunks in Excel over the week, and identified the biggest saturation points. I then pulled staffing information and call volume information and overlaid those on my new Excel sheet. By identifying those times where we were heavy on Spanish speaking staff, but low on Spanish speaking volume needs, I made suggestions on staff schedule changes that kept the labor the same, but would dramatically reduce our need of third party interpretive services. Needless to say, when I submitted the report, my manager was quite surprised.
The requests started to come in more frequent, and the problems were harder. I moved to Access, because of Excel’s limitations. That moved to more powerful RDBMS’ such as MSSQL or Oracle. I started to create fancy algorithms and data warehouses to support my analytical needs. But I did it all backwards.
Normally it works like this:
Have the Skill -> Presented the Problem -> Drive the Result
But I did it this way:
Presented the Problem -> Identify and Learn the Skill -> Drive the Result
This model really helped me appreciate data’s role in understanding problems and then using the data to better drive business decisions. It also helped train me in seeing the problem from both angles, from a business perspective and a technological perspective. I straddled both the IT and business sides of the house, which was definitely a tight-rope walking act.
Fast forward around 15 years, and data has been central to all my roles. I think the entrepreneurial mindset given to me by my father and having a good head for numbers really has shaped my career. I like to take the latest tools and help drive business decisions. I create metrics where they do not exist. I can anticipate needs better. And, most importantly, I work autonomously.
What are some of the most exciting developments you see happening in your industry right now?
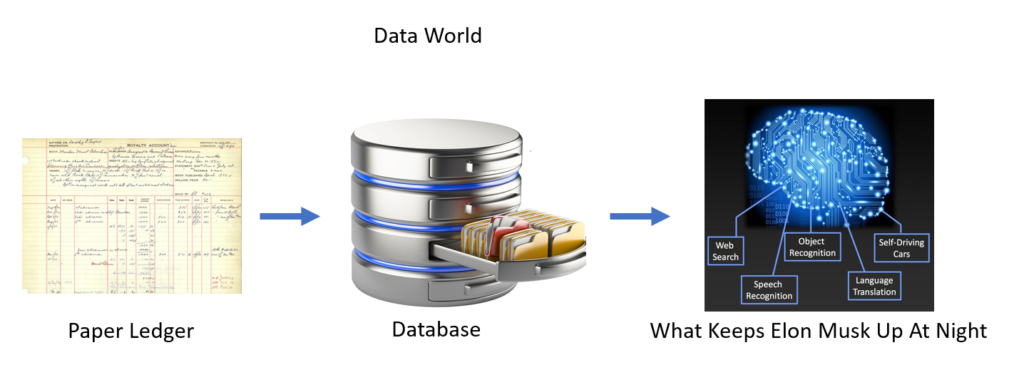
I think the re-branding of the industry is the most exciting development. When I first started, there were roles such as Analyst, or Business Analyst, or maybe a DBA. Today, those roles have been extrapolated. Data Scientist, Data Analyst, Viz (Visualization) Experts, Data Engineers, Data Architect, and even the management layer above teams made up of these Data Wizards requires a special skillset.
This re-branding of the positions puts focus on the people. The tools do become more sophisticated, but it is the people that drive these tools. A ‘Big Data’ warehouse is not going to answer your questions. A statistical model written in R is not going to tell a story. Neural Networks still require training. It is the people that drive the innovation from these tools.
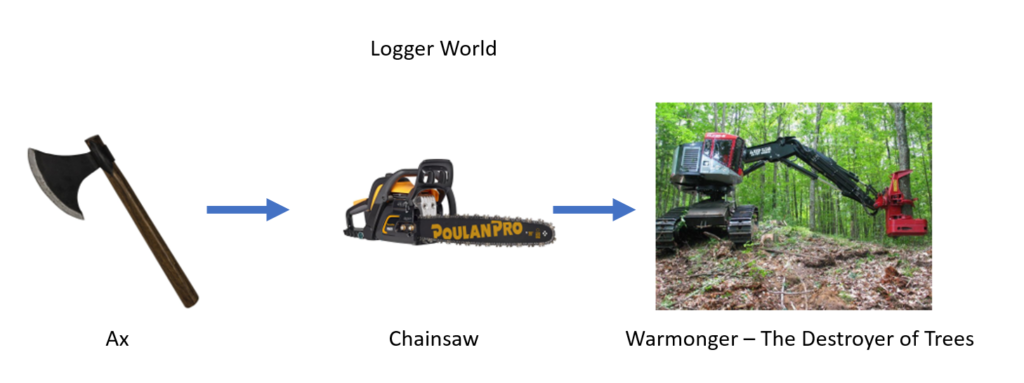
Take a look at a lumberjack. When you upgrade the tool, you increase the output and capabilities. You also then begin re-branding. This went from lumberjack, to logger, to logger equipment operator.
I will have to say, though, the tools are getting pretty cool:
What is the most satisfying aspect of your job?
There really are three types of satisfying moments that I experience when it comes to my career:
- Training and teaching others. I prefer to enable my business partners to answer their own questions. This helps me scale myself and help other people flesh out their skills. When I see it finally ‘click’ with someone, there is a deep sense of satisfaction. When someone supersedes my ability, that is truly awesome.
- When I see the results of a large scale data investigation impact the business (in a positive way). There’s something satisfying about being able to see the points through the data and tell a story, and then have someone action on that story, and then see the measurable positive impact.
- Doing something innovative. This is less frequent than the other two, but it is the best. Some of these items are protected, so I can’t go into detail, but it is thoroughly good.
Do you have any advice for someone considering a career in data science?
Don’t fear. I see people automatically think data science is too hard, or they are not smart enough, or that it won’t be fun. The fourth industrial revolution is coming in the form of AI and automation. While previous revolutions were fueled by steam, electricity, or fuel; this one is powered by data.
Anyone and everyone can start off as an analyst and work their way through the rungs. Sometimes, what is more important is domain expertise vs. analyst skills. Take for instance Joel Morrow, a LinkedIn friend of mine. Here is a gentleman who uses data to describe the fuel efficiencies of many long haul trucks, including deep dives into some of the modifications and their specs. It is fascinating. A welder can give an analysis on the difference between a good and bad welding job. Waitstaff can analyze the moods of their patrons and identify the effects on nearby tables. The possibilities are endless.
Once you have overcome some of those fears, you can find endless training online. I would then use some of those lessons to start answering the questions you already have.
- Meet Our General Manager: Nicole Cosme - February 26, 2024
- Can I use a coworking space for Google My Business? - April 26, 2023
- Marketing Lab: The Best Business Resource on the South Coast You Didn’t Know About - March 23, 2023